Back
28 Nov 2022
USD Index Price Analysis: Extra decline lies below the 200-day SMA
- The index resumes the downtrend and revisits the 105.30 region.
- The loss of the 200-day SMA opens the door to extra losses.
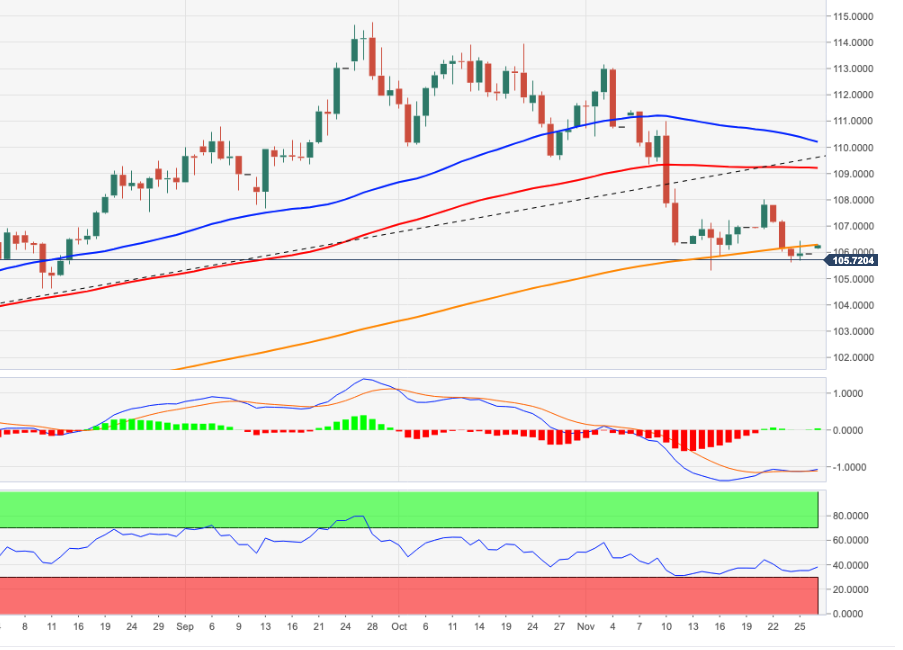
DXY comes under extra selling pressure and extends the breakdown of the key 106.00 barrier at the beginning of the week.
The selling pressure motivates the index to flirt with the always relevant 200-day SMA, today at 105.36. A drop below the latter is expected to allow for losses to accelerate and target the August low at 104.63 (August 10).
South of the 200-day SMA, the outlook for the index should shift to bearish.
DXY daily chart