GBP/USD Price Analysis: Cable bulls prod 50-DMA hurdle above 1.2100 as the key week begins
- GBP/USD rises to the highest levels in two weeks during a four-day uptrend.
- Clear upside break of 21-DMA, previous resistance lines join bullish MACD signal to favor buyers.
- Sellers need validation from 1.1920-10 support zone for conviction.
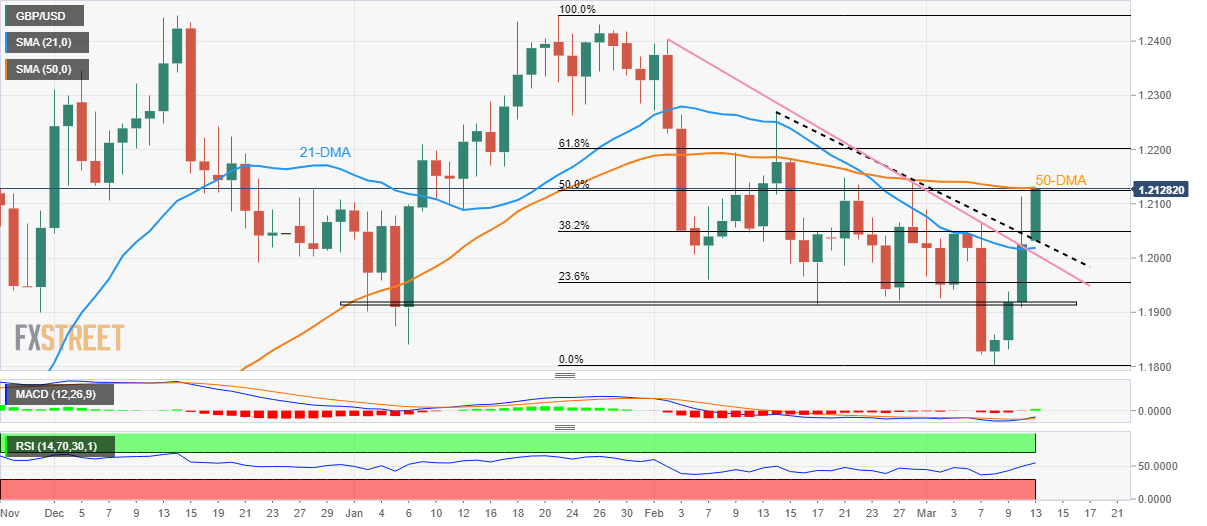
GBP/USD takes the bids to refresh a three-week high near 1.2125-30 during early Monday morning in Europe. It should be noted that the multiple catalysts including the UK jobs report and the US inflation data highlight this week an important one for the Cable traders.
That said, the quote cheers the upside break of the 21-DMA and previous resistance lines from early February. Adding strength to the north-side bias are the recently bullish MACD signals and the above 50 levels of RSI (14) that back the last week’s recovery moves.
It’s worth noting, however, that a convergence of the 50-DMA and 50% Fibonacci retracement level around 1.2130 appears the key hurdle for the GBP/USD buyers to cross to keep the reins.
Following that, the Cable pair’s run-up towards the 61.8% Fibonacci retracement level of late January to early March downturn and the mid-February swing high, respectively near 1.2205 and 1.2270 in that order, can’t be ruled out.
Meanwhile, the pullback move may initially aim for the one-month-old resistance-turned-support line, near 1.2030 at the latest, before poking the 21-DMA level of around 1.2020.
In a case where the GBP/USD bears keep control past 1.2020, the previous resistance line from February 02, near the 1.2000 psychological magnet at the latest, appears important to watch.
Even so, the GBP/USD pair sellers should remain cautious unless it breaks the nine-week-old horizontal support line near 1.1920-10.
GBP/USD: Daily chart

Trend: Further upside expected
