Back


26 Jul 2019
GBP/USD technical analysis: Cable trading near daily lows post US GDP, sub-1.2435
- GBP/USD remains soft following the release of the better-than-expected US GDP data.
- The levels to beat for bears are seen at 1.2388 and 1.2340, according to the Technical Confluences Indicator.
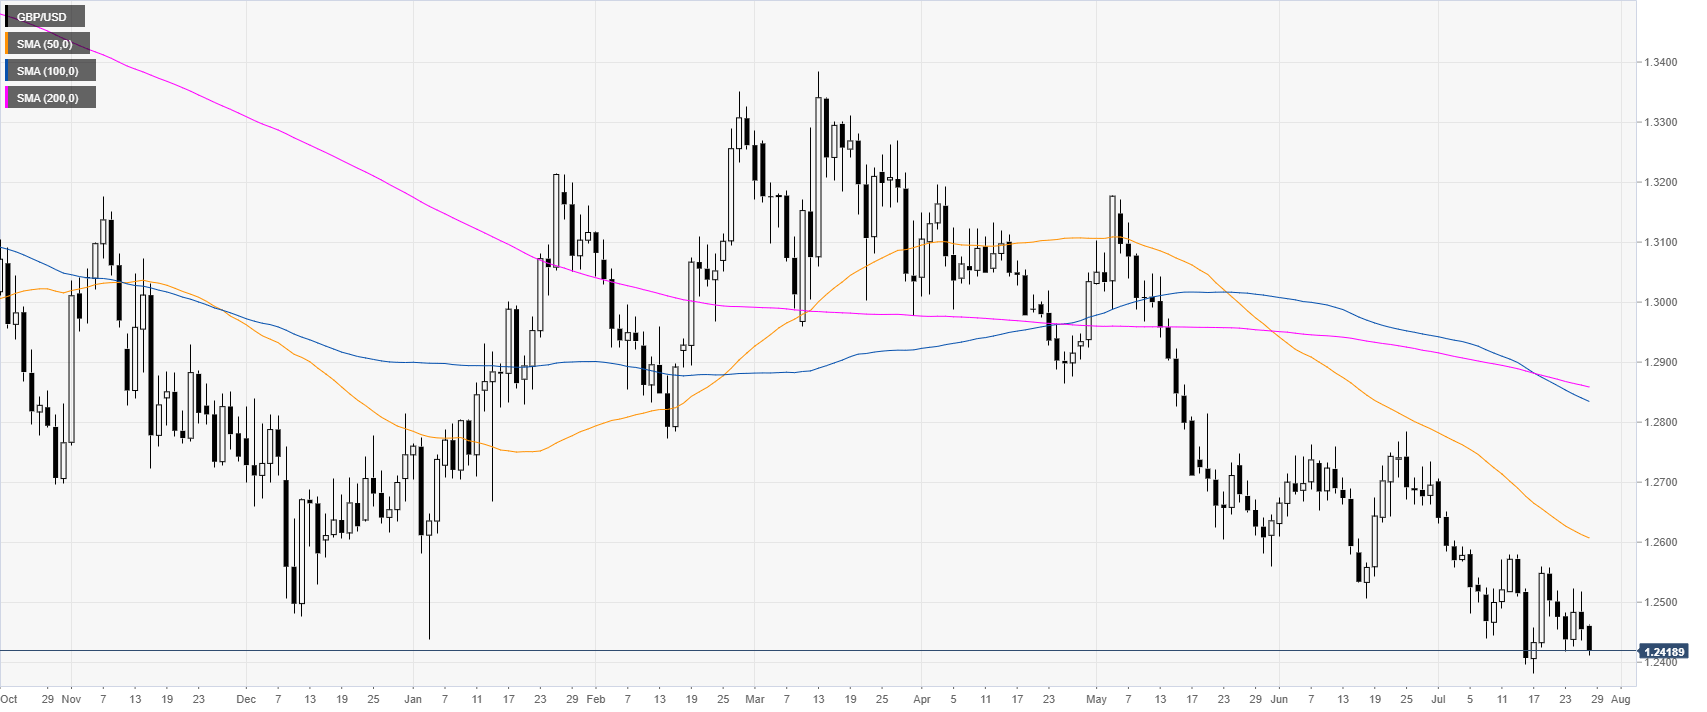
GBP/USD daily chart
Cable is trading near 6-day lows while below the main daily simple moving averages (DSMAs). The US Gross Domestic Product (GDP) Annualized Q2 came in above expectations at 2.1% vs. 1.8% forecast by analysts, helping the USD to inch higher.
GBP/USD 4-hour chart
GBP/USD broke below 1.2435 support while trading below descending SMAs suggesting a negative bias in the medium term. Bears want to reach 1.2388 and 1.2340 on the way down. Resistances are seen near 1.2435 and 1.2480, according to the Technical Confluences Indicator.
GBP/USD 30-minute chart
Cable is under pressure below its main SMAs. Immediate resistances are seen near 1.2435 and 1.2480, according to the Technical Confluences Indicator.
Additional key levels